
FullStack Software Labs Team
Edge Computing Solutions for Charleston Businesses
Implement edge computing for Charleston SC businesses. Distributed processing, 5G integration & latency optimization from veteran owned edge computing experts.
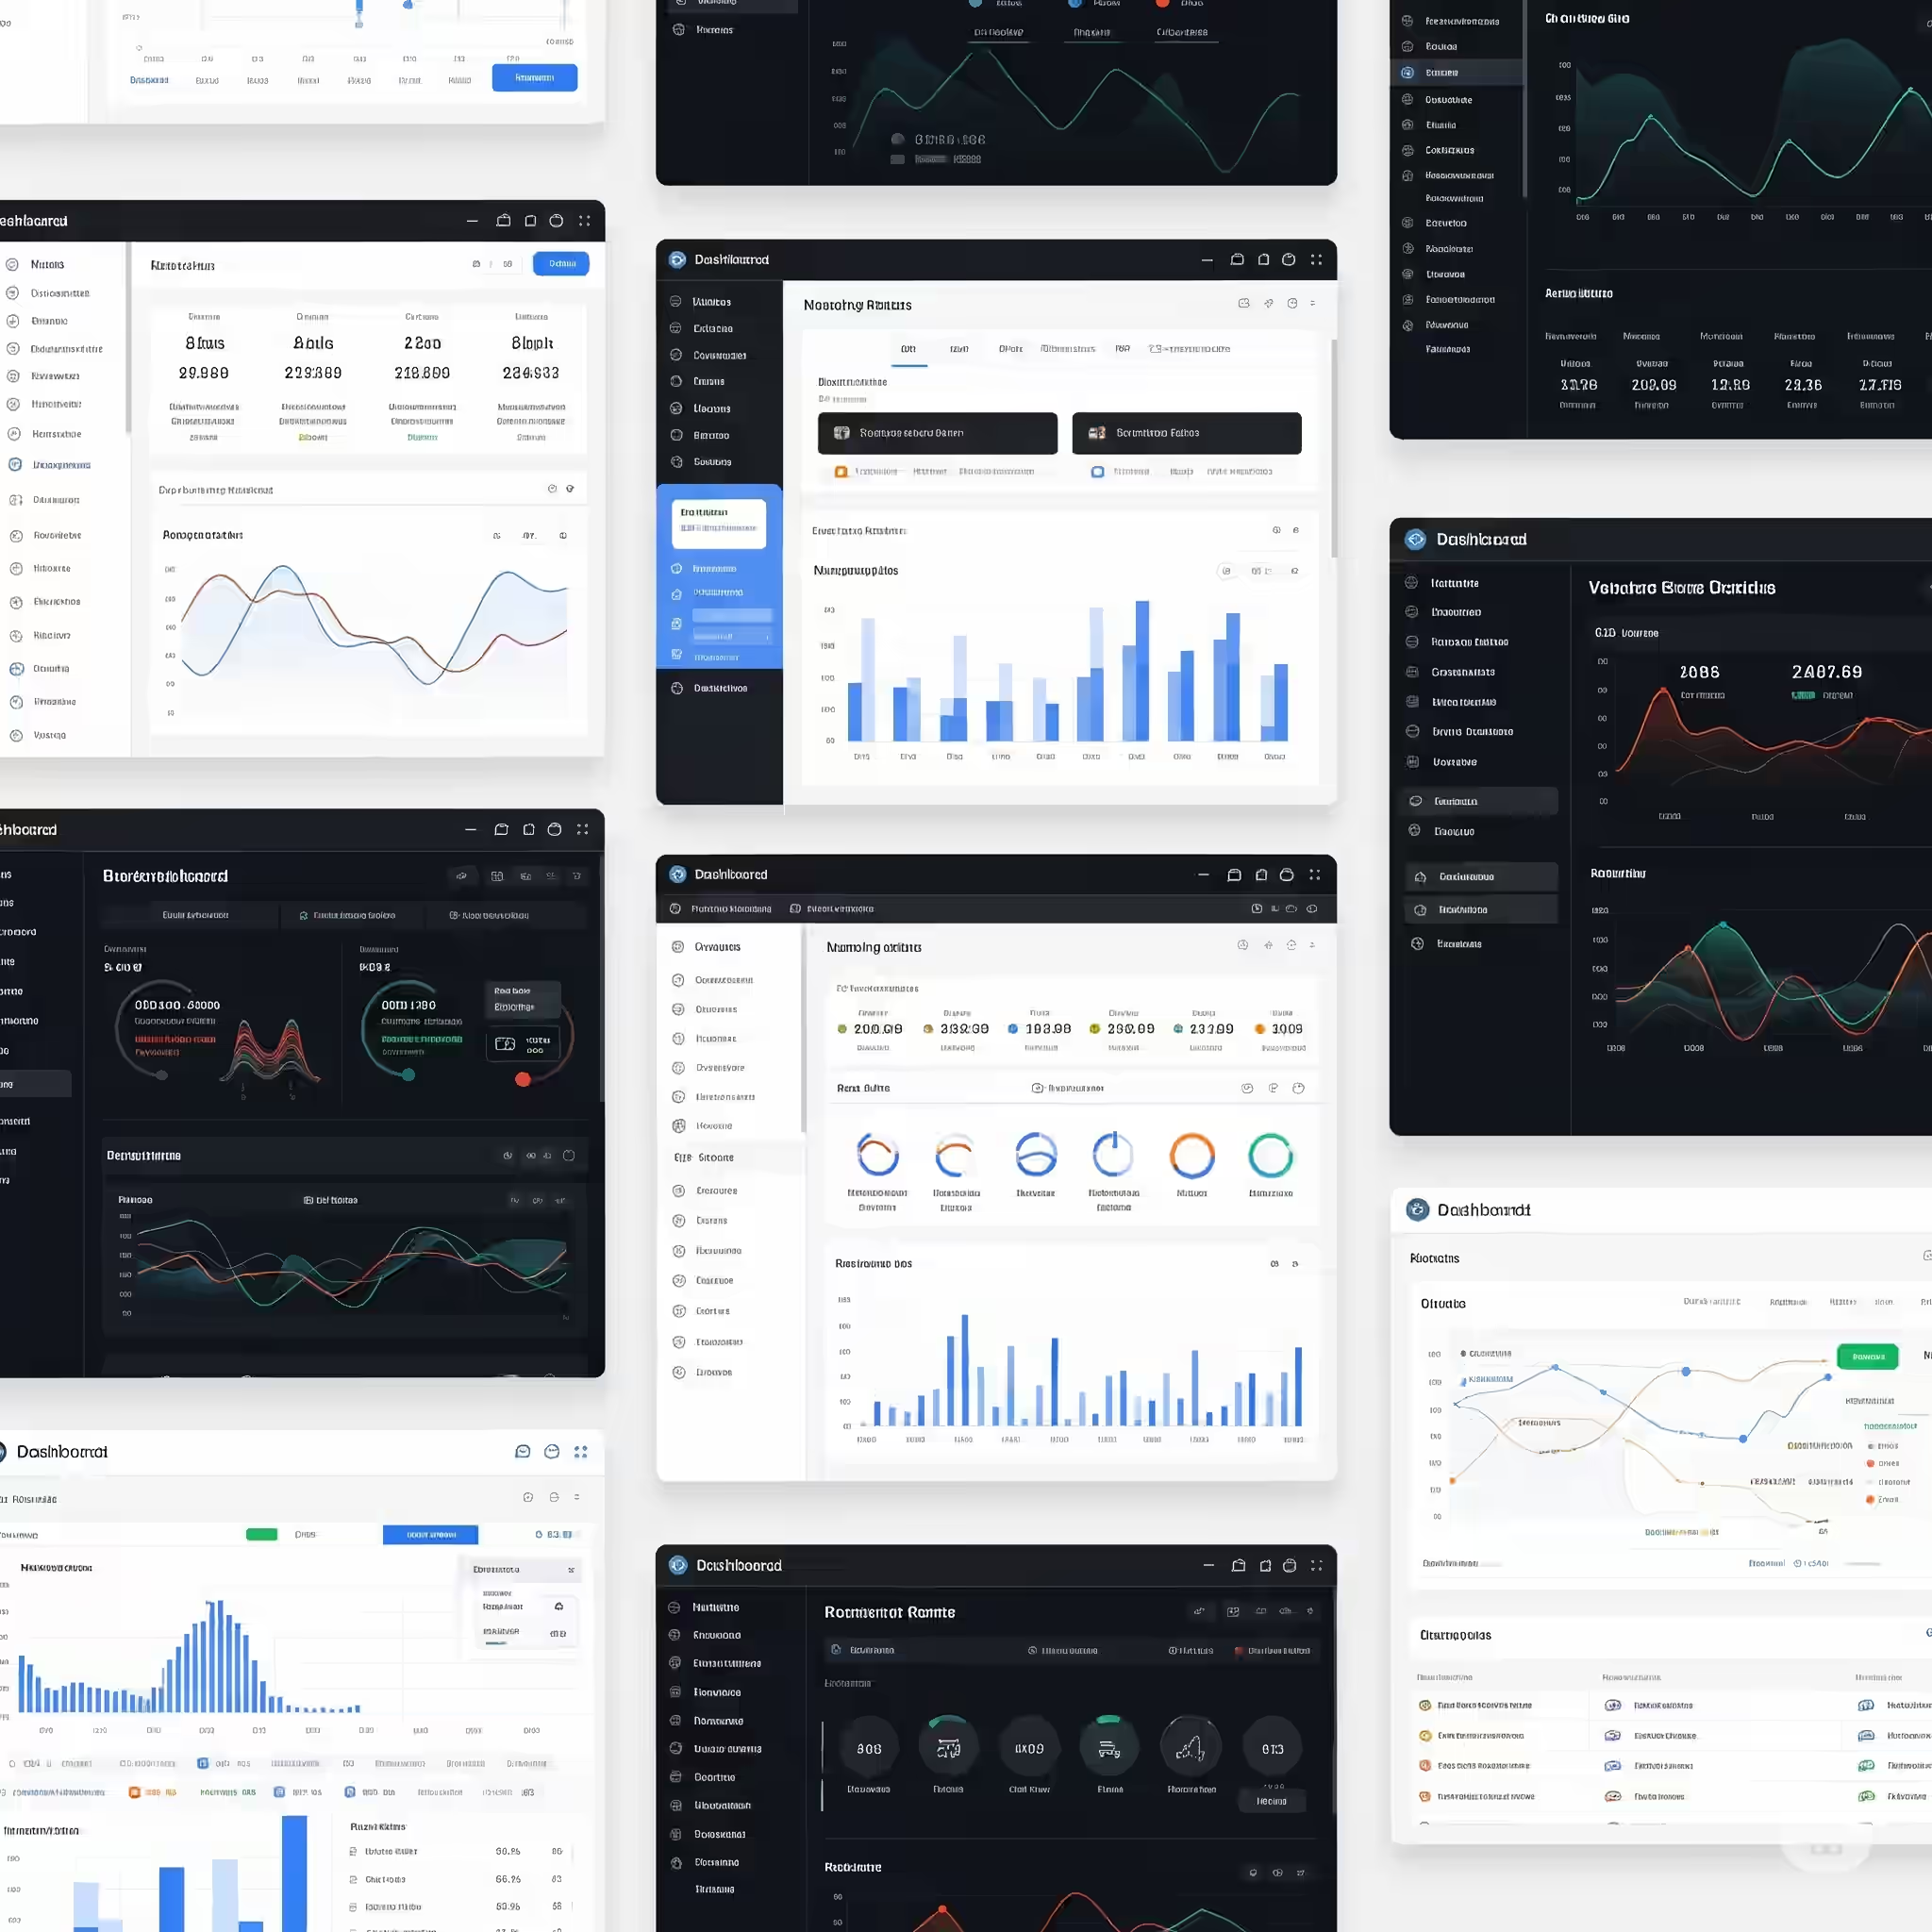
Monitor your business metrics with live data updates and instant insights.
Track key performance indicators with customizable metrics and alerts.
Transform complex data into clear, actionable visual insights.
Track system health, uptime, and performance metrics in real time.
Without proper data visualization, businesses struggle with scattered information, delayed insights, and missed opportunities
Critical business data trapped in spreadsheets and databases, invisible to decision makers.
Manual report generation taking hours or days, providing outdated information.
Data scattered across multiple systems with no unified view of business performance.
No real time notifications when KPIs fall below thresholds or anomalies occur.
Making business decisions based on gut feeling instead of data driven insights.
Leadership lacks visibility into operations, sales, and performance metrics.
Business dashboards are essential for companies that want to make data driven decisions and stay competitive.
Perfect for businesses with data spread across CRM, ERP, marketing, and other systems.
Essential for scaling companies needing to monitor increasing complexity and metrics.
Critical for teams that need to track KPIs, goals, and performance against targets.
Ideal for businesses requiring immediate insights for operational decisions.
Perfect for organizations wanting transparency and shared visibility across teams.
Essential for companies using data as a competitive advantage in their market.
Comprehensive analytics tools that transform your raw data into actionable business intelligence
Live data feeds from all your business systems updated instantly as changes occur.
Charts, graphs, maps, and widgets tailored to your specific business needs.
Scheduled reports delivered automatically to stakeholders via email or Slack.
Responsive dashboards accessible from any device, anywhere, anytime.
Instant notifications when metrics exceed thresholds or anomalies are detected.
Connect to databases, APIs, spreadsheets, and cloud services seamlessly.
Role based access control ensuring teams see only relevant data.
Trend analysis and historical comparisons to identify patterns and growth.
Export data and visualizations in multiple formats for presentations and reports.
Expert guidance on custom software development from our veteran team.
Implement edge computing for Charleston SC businesses. Distributed processing, 5G integration & latency optimization from veteran owned edge computing experts.

Implement real time data processing for Charleston SC enterprises. Stream processing, analytics & ML pipelines from veteran owned data processing experts.

Complete ROI maximization guide for Charleston SC company websites. Conversion optimization, analytics & growth strategies from veteran owned experts.
Complete end to end development solutions from frontend to backend, databases, and deployment covering every aspect of your digital needs.
Flexible pricing and service packages designed to fit businesses of all sizes, from startups to enterprise organizations.
Round the clock monitoring and support to keep your business running smoothly.
Let's discuss your project and create a custom solution that drives your business forward. Schedule your free consultation today.
Stay up to date with our new collections, latest deals and special offers! We announce a new collection every week so be sure to stay tuned.